What's Smart Narrative in Power BI?
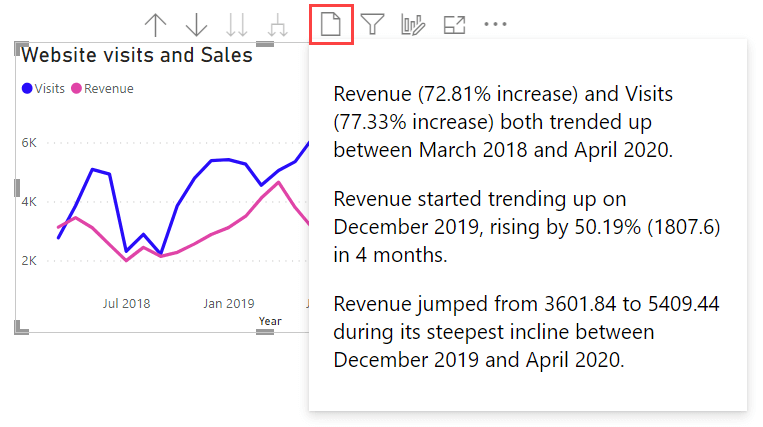
A smart narrative in Power BI is a feature that automatically generates written summaries of your data. It uses natural language processing (NLP) to analyze the data and create a narrative that explains what the data means in a way that is easy for people to understand.
This feature can be very helpful for businesses and organizations that need to communicate data insights to stakeholders who may not have a background in data analysis. By using a smart narrative, you can quickly and easily create a written summary of your data that is accessible to a wider audience.
You can add:
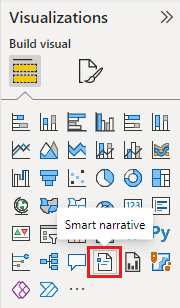
- A smart narrative for a page.
- A smart narrative for a visual.
1) Can you use Smart Narrative in Power BI Report Server?
As a short answer, NO. the Smart Narrative is currently only available in Power BI Service.
2) Limitation of Smart Narrative in Power BI
The smart narrative feature doesn't support the following functionality:
- Pinning to a dashboard
- Using dynamic values and conditional formatting (for example, data bound title)
- Publish to Web
- Power BI Report Server
- Live Connection to Azure Analysis Services or SQL Server Analysis Services
- MultiDimensional Analysis Services data sources
- Map visual with non-aggregated latitude or longitude
- Multi-row card with more than three categorical fields
- Cards with non-numeric measures
- Tables, matrices, R visuals or Python visuals, custom visuals
- Summaries of visuals whose columns are grouped by other columns and for visuals that are built on a data group field
- Cross-filtering out of a visual
- Renaming dynamic values or editing automatically generated dynamic values
- Summaries of visuals that contain on-the-fly calculations like QnA arithmetic, complex measures such as percentage of grand total and measures from extension schemas.
- Calculation groups
Learn more at Create smart narrative summaries